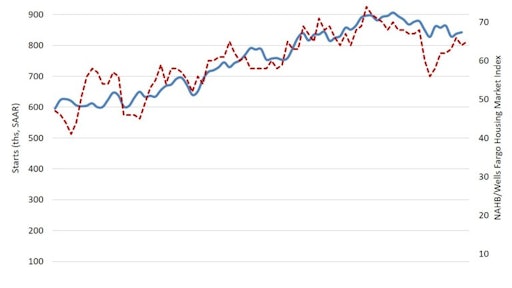
Single-family starts, long considered a leading indicator of U.S. economic strength, rose 3.5% in June to an 847,000 seasonally adjusted annual pace, according to U.S. Housing and Urban Development and Commerce Department estimates. The improvement supports the National Association of Home Builders (NAHB)/Wells Fargo Housing Market Index (HMI), which saw builder confidence in the market for newly-built single-family homes hold steady for the sixth consecutive month.

Year-to-date, single-family starts are 4.9% lower than the first six months of 2018. On a regional and year-to-date basis, they are down 13.6% in the Northeast, 13.4% in the West and 8.3% in the Midwest, with a slight 1% gain in the South, the NAHB reports.
Single-family permits in June rose slightly to an 813,000 annualized rate, but are down 6.1% on a year-to-date basis. The number of single-family units authorized but not under construction also declined in June to 85,000 units, down from 90,000 a year ago. While troubling on the surface, Robert Dietz, NAHB chief economist, sees this as a potential signal of permit growth ahead, noting that single-family units authorized but not under construction did not reach a 2018 peak (103,000) until December of that year.
As of June 2019, 519,000 single-family homes were under construction. “This is roughly flat from a year ago,” Dietz noted. “However, there are currently 616,000 apartments under construction, the highest count since April 2017. The cumulative impact of recent declines in current construction activity are seen in the graph below. This impact is responsible for a slight decline in housing’s share of GDP.”
 National Association of Home Builders
“We expect additional single-family growth, as areas beyond the exurbs (outlying counties of large metro areas) respond to for-sale housing demand and ongoing healthy labor markets,” he anticipated.
The next quarterly edition of the Home Building Geography Index (HBGI) - which segments the U.S. housing market based on Census data on county-level residential building permits - will report on such conditions. Unveiled in May 2019, the HBGI replaces the Leading Market Index (LMI) previously used to track the housing market's post-Great Recession recovery.


![Brian Bieller Release[86]](https://img.forconstructionpros.com/files/base/acbm/fcp/image/2023/05/Brian_Bieller_Release_86_.644feae4055af.png?auto=format%2Ccompress&fit=crop&h=191&q=70&rect=0%2C159%2C1920%2C1080&w=340)