The striping-only sales segment totaled a fairly surprising $89,944,736. We wish that it was a positive surprise, but this year marks the lowest reported amount for this sector going back the last ten years, and a drop of $40 million from just last year. At a glance, it might appear that the sector is in an overall downward trend, but that's not really the whole story. Between the years 2015-2018, things remained relatively stable, and, in fact, seemed to be growing at a solid 8.95% but that was the last year of what might be deemed stable numbers.
View Top 50 Contractors: Striping
From 2018 to 2019 things spiked in a tremendous way, and stayed pretty close to that in the following year 2020. However, the pandemic lockdowns definitely had some level of impact, cutting the striping-only sales in half. Not taking into account 2022, where we received some reports that were later unable to be fully verified, 2023 appeared to show the striping segment rebounding. While this year's contractions is disappointing, there's a faint positive hiding in the numbers. The average rate of change by year is still +$2.9 million. That's not a growth rate that blows anyone away, but it's still a positive level of growth. We'd definitely like to see that continue to improve in the coming seasons.
A review of the past decade:
- 2015 - $112 million
- 2016 - $133
- 2017 - $139
- 2018 - $144
- 2019 - $215
- 2020 - $204
- 2021 - $100*
- 2022 - $534**
- 2023 - $130
- 2024 - $90
*Pandemic shutdowns
**Invalidated/unverifiable data
Total Sales For The Striping Top 50
The total gross sales for all work done by the 2024 Top 50 Striping contractors came to $1.435 billion, which is also a slight contraction when compared to last year's reported total of $1.583 billion. That's a negative change of about $148 million missing from the Top 50 Striping contractors. Once again, there's some silver lining to these numbers, as well, due to the invalidated data messing with the 2022 figures. Because of that we will ignore that one year, and then what we see is actually pretty promising for those contractors who's main source of revenue is striping.
In 2021, the total gross sales for the Striping Top 50 was $890 million, which means that the average rate of change in total sales for the Striping Top 50 since 2021 is about 23% and that's really excellent. For the contractors who do a heavy amount of striping, the business model seems to be doing really well.
Only 5 contractors in the Top 50 did received more than 75% of their gross sales from striping, but 1 of those 5 exclusively did nothing but striping. Everyone, besides that one outlier, did a mix of everything, with 1 other contractor hitting 90% and the remaining 10% completed in sealcoating.
Profit Margins
The profit margin distribution for the Striping Top 50 is, perhaps, the most intriguing since the alteration of the range percentages. This is because the top four (of the five total) ranges are all very close. There's almost an even number of contractors in each range, meaning that of our Top 50, everyone was kind of doing there own thing. There's not a strong sense of the profit margin levels across the industry like there is in paving, for example: where a strong majority all exist in the higher end of the spectrum. Striping is not as top heavy.
- Those who reported the highest profit margins, more than 20%, represented 32% (16 contractors) of the field
- 22% (11) of contractors ranked in the 16-20% profit margin range
- Under the previous distribution model, that 54% of contractors would've been in the highest range
- That's a 6% increase over last year's 48%, and seems to give some evidence to broad profitability
- 24% (12) of the Top 50 ranked in the 10-15% profit margin range, another drop down from 28% in 2023 and 37% in 2022, suggesting the trend is upwardly mobile
- 20% (10) contractors landed in the 6-9% range, and just 2% (1) in the lowest range of less than 5%
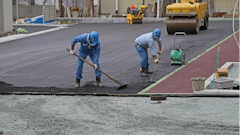
Type of Work
The mix of work is slightly misleading in this case, because it isn't really a reflection of where the Top 50 Striping contractors did striping per se, but a breakdown of the places they completed any type of work. It's still interesting, and worth taking a look at.
- 52% of contractors did work on driveways at an average rate of 9% of their gross sales composition
- 18% of contractors completed some highway work and at an average rate of 10% of their gross sales composition
- Unsurprisingly, 100% of contractors completed parking lot work at an average rate of 37% of their gross sales
- 76% completed residential street projects at an average rate of 21% of their gross sales
- 22% completed work in undefined "other" areas, and, interestingly, one outlier did a whopping 74% of their gross sales there
Customer Mix
Same as last year, 100% of contractors did work for commercial and/or industrial clients
82% of contractors did work for municipalities at an average customer mix of 17%
94% of the Top 50 completed work for multi-family, residential properties at an average mix of 24%
and 50% of the list did some work for single-family residential properties at an average mix of 10%
Fleet Replacement
2% of contractors reported it would only take between $250,000-$500,000 for total fleet replacement
10% reported it would require between $500K - $1 million
24% would need betwee $1 million - $2 million
and a staggering 64% would need more than $2 million to fully replace their current fleets